by | ARTICLES, BUSINESS, ECONOMY, FREEDOM, GOVERNMENT, OBAMA, POLITICS, TAX TIPS, TAXES
The Fix the Debt Campaign Steering Committee is a bipartisan group of prominent leaders and experts, including luminaries such as Erskine Bowles and Alan Simpson, the co-chairs of the White House Fiscal Commission. The Fix the Debt group put together some decent graphics regarding federal spending.
This is a “taxpayer receipt” highlighting where the money goes and highlight where it comes from in the first place.
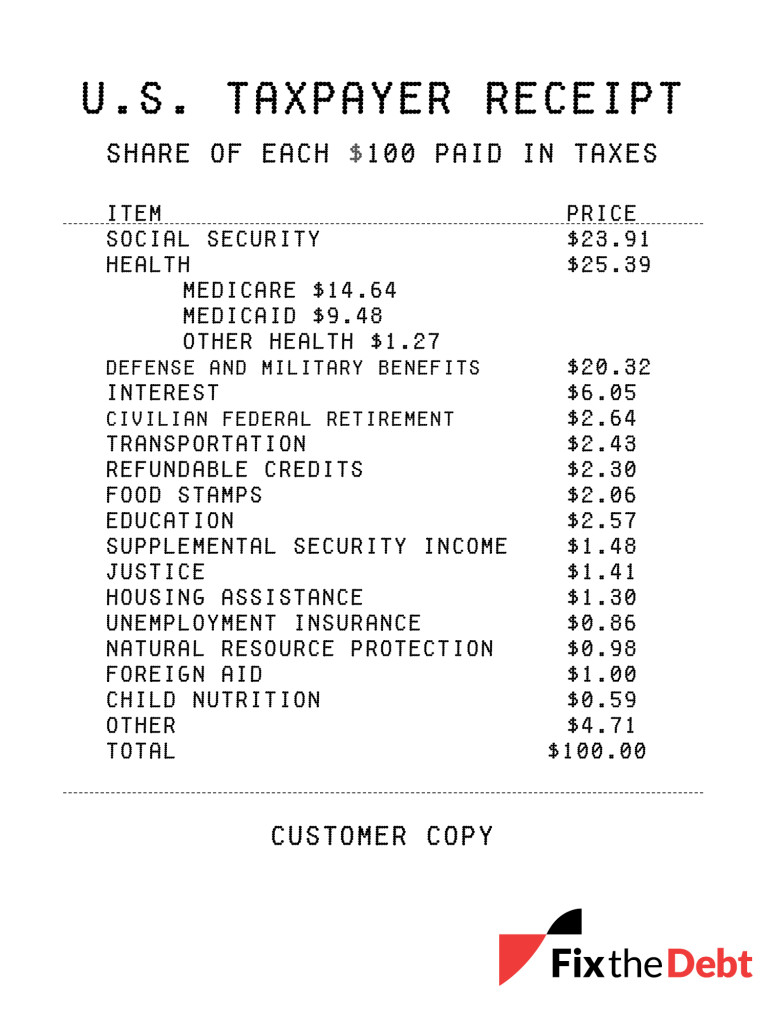
How are our federal tax dollars spent? As the taxpayer receipt illustrates, more than $75 of every $100 paid in federal taxes goes to Social Security, federal health care, defense, and interest on the debt. And the amounts for Social Security, health care, and interest are forecast to grow considerably in the years to come.
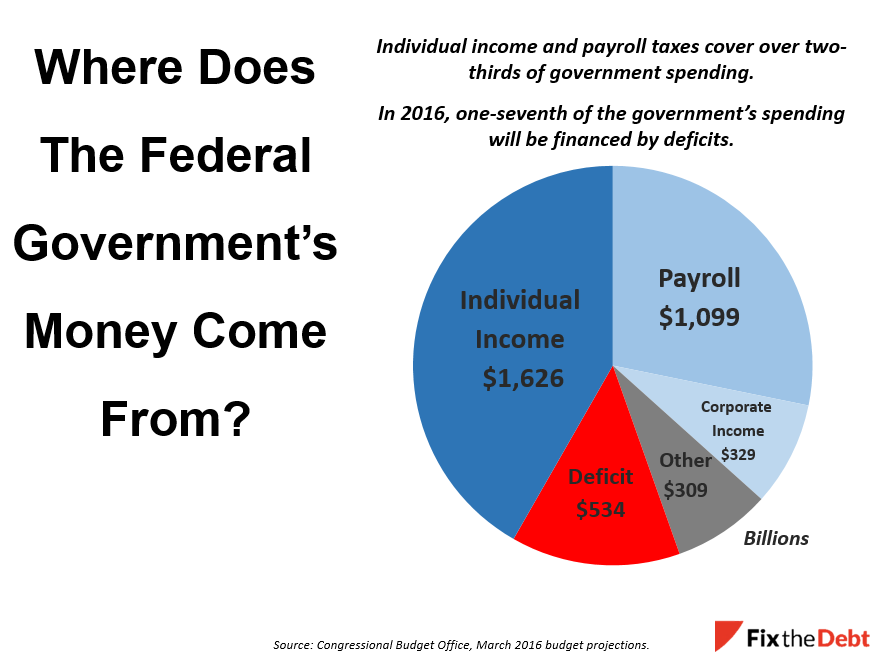
Where does the money come from? Much of the revenue for the federal government comes from the individual income tax that many of us are rushing to complete. Another major source is the payroll tax, which is the “FICA” tax that is withheld from your paycheck. It is used to fund Social Security benefits and parts of Medicare.
But a significant part of the government is deficit financed because spending exceeds revenue. That share is expected to grow substantially in the years ahead.
Check out their blog for more information.
by | ARTICLES, BLOG, BUSINESS, ECONOMY, ELECTIONS, FREEDOM, OBAMA, POLITICS, TAXES
I like CNSNews, because they provide straightforward number-crunching on fiscal minutia that is tedious yet important data. This week as we enter the 8th year of Obama’s term, they have calculated that federal debt has increased more than $70,000 per household during the 7 years Obama has held office thus far.
From CSNNews:
“The debt of the federal government increased by $8,314,529,850,339.07 in President Barack Obama’s first seven years in office, according to official data published by the U.S. Treasury.
That equals $70,612.91 in net federal borrowing for each of the 117,480,000 households that the Census Bureau estimates were in the United States as of September.
During President George W. Bush’s eight years in office, the federal debt increased by $4,899,100,310,608.44, according to the Treasury. That equaled $44,104.65 in net federal borrowing for each of the 111,079,000 households that, according to the Census Bureau, were in the country as of Jan. 20, 2009, the day that Bush left office and Obama assumed it.
In the fifteen years from the beginning of Bush’s first term to the end of Obama’s seventh year in office, the federal debt increased $13,213,630,160,947.51.
That $13,213,630,160,947.51 increase in the debt during the Bush-Obama years equals $112,219.57 for each of the 117,748,000 households that were in the country as of September.
When Bush took office on Jan. 20, 2001, the federal debt was 5,727,776,738,304.64. When Obama took office eight years later, on Jan. 20, 2009, the federal debt was 10,626,877,048,913.08.
As of Jan. 20, 2016, when Obama completed his seventh year in office, the federal debt was $18,941,406,899,252.15.