by | ARTICLES, BUSINESS, ECONOMY, FREEDOM, GOVERNMENT, OBAMA, POLITICS, TAX TIPS, TAXES
The Fix the Debt Campaign Steering Committee is a bipartisan group of prominent leaders and experts, including luminaries such as Erskine Bowles and Alan Simpson, the co-chairs of the White House Fiscal Commission. The Fix the Debt group put together some decent graphics regarding federal spending.
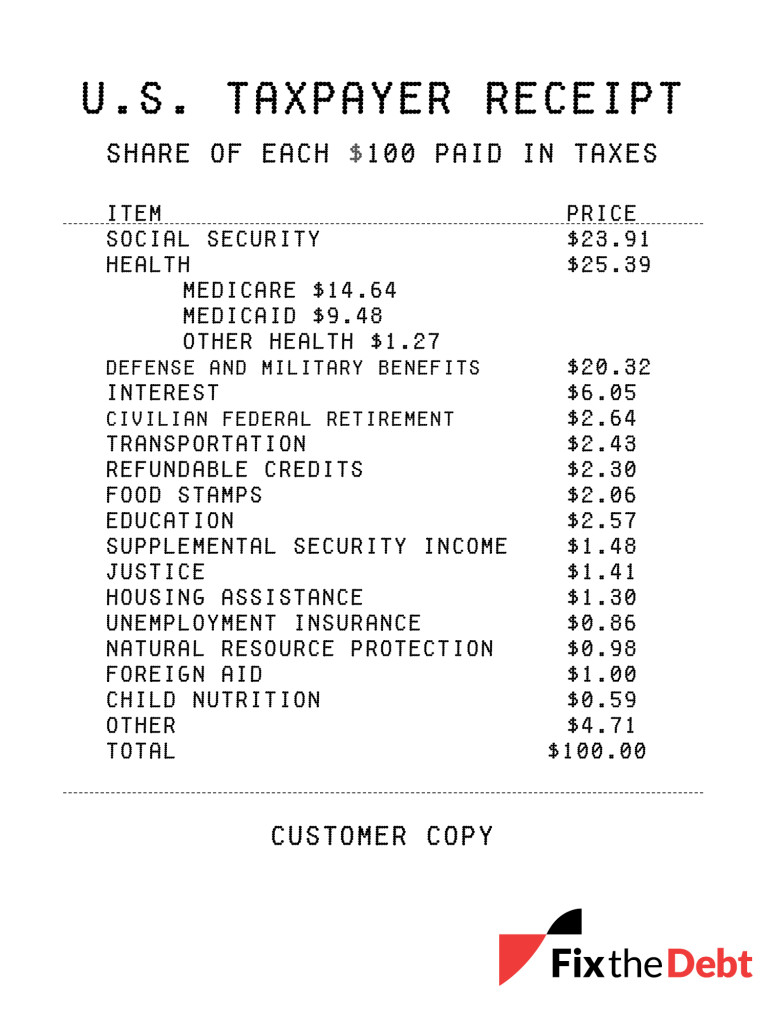
This is a “taxpayer receipt” highlighting where the money goes and highlight where it comes from in the first place.

How are our federal tax dollars spent? As the taxpayer receipt illustrates, more than $75 of every $100 paid in federal taxes goes to Social Security, federal health care, defense, and interest on the debt. And the amounts for Social Security, health care, and interest are forecast to grow considerably in the years to come.

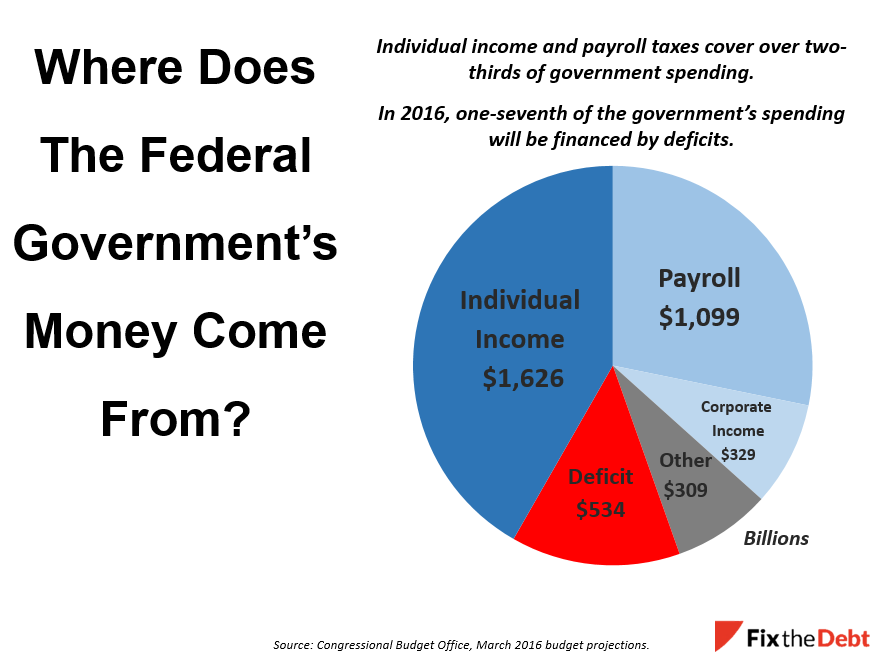
Where does the money come from? Much of the revenue for the federal government comes from the individual income tax that many of us are rushing to complete. Another major source is the payroll tax, which is the “FICA” tax that is withheld from your paycheck. It is used to fund Social Security benefits and parts of Medicare.
But a significant part of the government is deficit financed because spending exceeds revenue. That share is expected to grow substantially in the years ahead.
Check out their blog for more information.
by | ARTICLES, BLOG, ECONOMY, FREEDOM, GOVERNMENT, OBAMA, POLITICS, TAXES
Each month, CNSNews does a nice roundup of the monthly Treasury statements which show revenue and expenditures for the prior month. As has been the case for the last few months, the month of July has been another record setting month for revenues. Even with that, the government still continues to run a deficit for the year — their annual spending outpacing their receipts.
From CNSNews:
“The federal government raked in a record of approximately $2,672,414,000,000 in tax revenues through the first ten months of fiscal 2015 (Oct. 1, 2014 through the end of July), according to the Monthly Treasury Statement released today.
That equaled approximately $17,955 for every person in the country who had either a full-time or part-time job in July.
It is also up about $183,397,970,000 in constant 2015 dollars from the $2,489,016,030,000 in revenue (in inflation-adjusted 2015 dollars) that the Treasury raked in during the first ten months of fiscal 2014.
Despite the record tax revenues of $2,672,414,000,000 in the first ten months of this fiscal year, the government spent $3,137,953,000,000 in those ten months, and, thus, ran up a deficit of $465,539,000,000 during the period.
According to the Bureau of Labor Statistics, total seasonally adjusted employment in the United States in July (including both full and part-time workers) was 148,840,000. That means that the federal tax haul so far this fiscal year has equaled $17,954.94 for every person in the United States with a job.
In 2012, President Barack Obama struck a deal with Republicans in Congress to enact legislation that increased taxes. That included increasing the top income tax rate from 35 percent to 39.6 percent, increasing the top tax rate on dividends and capital gains from 15 percent to 20 percent, and phasing out personal exemptions and deductions starting at an annual income level of $250,000.
An additional 3.8 percent tax on dividends, interests, capital gains and royalties–that was embedded in the Obamacare law–also took effect in 2013.
The largest share of this year’s record-setting October-through-July tax haul came from the individual income tax. That yielded the Treasury $1,276,630,000,000. Payroll taxes for “social insurance and retirement receipts” took in another $894,374,000,000. The corporate income tax brought in $266,068,000,000.”
by | ARTICLES, ECONOMY, FREEDOM, GOVERNMENT, OBAMA, OBAMACARE, POLITICS, TAX TIPS

This Washington Times piece did a nice overview of FY2014:
The Treasury Department unveiled its Fiscal Year 2014 numbers, which showed that the government’s revenue, for the first time ever, hit the $3 trillion mark. However, the government still overspent its revenues, leaving a $483 billion deficit.
Supporters of President Obama are touting the “success” of a $483 billion deficit by pointing out its the lowest deficit since 2008. A “mere” $483 billion deficit is not something to be celebrated. It means that, despite record revenues, the government still engages in out-of-control spending.
By comparison:
“The government first hit the $1 trillion revenue mark in 1990, then hit the $2 trillion mark in 2000. But President George W. Bush’s tax cuts and the bursting of the 1990s Internet bubble cut into revenue, dropping it to $1.8 trillion in 2003, before it began the shaky climb to $3 trillion.
Just five years ago, in 2009, the trough of the recession, revenue was only $2.1 trillion. That means it’s leapt $900 billion in just five years.”
And here’s where the dichotomy lies. The Left sees high government revenue as something to be celebrated, while the Right understands that high government revenue means less money for the private sector. “Every one of those $3 trillion is sucked out of the private-sector economy and makes the private sector smaller,” said Chris Edwards, director of tax-policy studies at the Cato Institute. “The $3 trillion isn’t free. It comes out of our pockets and from the private economy.”
Contrast his analysis with Jack Lew’s, Treasury Secretary. “The president’s policies and a strengthening U.S. economy have resulted in a reduction of the U.S. budget deficit of approximately two-thirds — the fastest sustained deficit reduction since World War II,” Mr. Lew said.
What are those “president’s policies”? Successful tax hikes. The highest 2% earners saw their tax margins increase; all earners saw their payroll taxes go up. And don’t forget the Obamacare taxes. The full list of all of Obama’s tax increases can be found here.
Perhaps the most profound statement can be summed up here: “Spending, meanwhile, has remained relatively flat at about $3.5 trillion.”
When spending is “flat” at $3.5 trillion, we definitely have a problem. Each year since 2009, the Obama Administration has spent over $3 trillion, the only president to ever do so: From 2009 – 2013 respectively, here are the numbers of spending in per year: 2009: $3,517,677; 2010: 3,457,079; 2011: $3,603,059; 2012: $3,537,127; 2013: $3,454,605. For a full chart of historical federal spending per year, go here. Federal spending has remained consistent at around $3.5 trillion/year — consistently high. Over-budget. And adding deeply to the deficit each year.
It will be interesting to revisit this next year at the end of FY2015, when Obamacare, the crowning Obama policy achievement, really gets going. Remember how Obamacare was going to reduce deficits? About that. The Weekly Standard recently did a thorough analysis of Obamacare projections and found that:
“So, compared to the deficit surplus of $180 billion for 2015-24 that a straight extrapolation from the CBO’s 2012 scoring would yield, current projections now indicate that Obamacare’s decreased spending (in relation to prior expectations) will reduce deficits by another $83 billion (bringing the estimated surplus to $263 billion), but those projected surpluses will be more than offset by the projected $132 billion decrease in Medicare revenue and $262 billion decrease in tax revenue due to lower job growth.
In all, therefore, CBO projections indicate that Obamacare will increase deficit spending by $131 billion from 2015-24. That’s a $311 billion swing from the extrapolated 2012 numbers, a $240 billion swing from the actual 2012 numbers, and a $255 billion swing from what we were told when Obamacare was passed.
So, this fiscal year was more of the same. Government overspending, gleefully celebrated by record tax collections of your hard earned dollars. The rapacious government needs to be fed.
by | ARTICLES, BUSINESS, ECONOMY, GOVERNMENT, OBAMA, POLITICS, TAXES

The government is still running more than a half-trillion dollar deficit right now, with one month left to go in the fiscal year, despite record revenue being hauled in.
CNSNews reports that “Inflation-adjusted federal tax revenues hit a record $2,663,426,000,000 for the first 11 months of the fiscal year this August, but the federal government still ran a $589,185,000,000 deficit during that time, according to the latest Monthly Treasury Statement.”
Thus, the government is still over-spending, to the tune of $3,252,611,000,000 in total expenses so far this year.
Here’s the breakdown of revenue:
Individual income taxes: $1,233,274,000,000
Corporate income taxes: $247,200,000,000
Employment and general retirement (off-budget): $674,338,000,000
Employment and general retirement (on-budget): $209,281,000,000
Unemployment insurance: $54,591,000,000
Other retirement receipts: $3,155,000,000
Excise taxes: $73,051,000,000
Estate and gift taxes: $17,702,000,000
Customs duties: $30,902,000,000
Miscellaneous receipts: $119,933,000,000
So just remember, the problem isn’t enough tax revenue or underfunded programs — it’s that the government can’t seems to stay on budget or within its revenue receipts. All this overspending does is just continue to add to the growing deficit.


